Monday, October 24, 2005

Geodatabase... GIS Database... Part 2


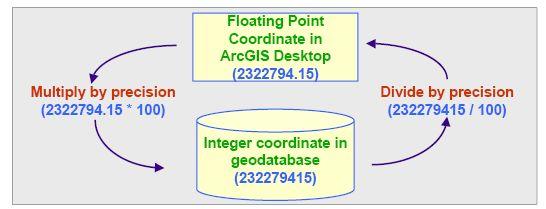
Precision and Integer bytes

In order to fully understand precision and spatial domain, you need understand the computer binary number system.

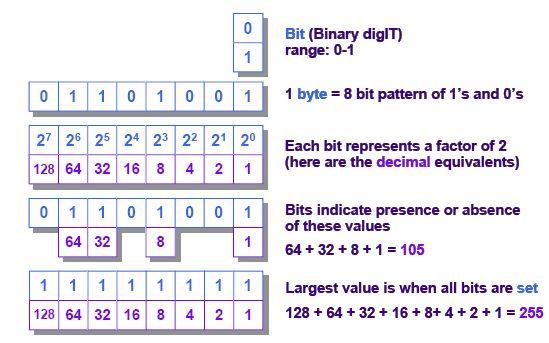
Bits - A digit in the binary number system is called a bit. The smallest binary digit is 0. The next, and only other, digit is a 1. Compare this with the decimal number system, which uses ten digits between 0 and 9, inclusive.

Bytes - In the decimal number system, when you run out of values for a given digit you need to use an additional digit to store a larger number. For example, if you wanted to store a number bigger than 9, you would need to add a second digit to produce the next largest number, 10. The binary number system works the same way. After exhausting both values for a single digit, you need to add an additional digit to store a larger number. For example, the smallest (positive) binary number is 0. The next largest is 1. After that, you need to add a second digit to represent the next highest number: 10. The next few numbers in this sequence are 11, 100, 101, 110, 111, and 1000. The decimal equivalents of these binary numbers are 3, 4, 5, 6, 7, and 8.

From this progression, it is easy to see that many binary digits are required to store relatively small numbers. Therefore, programmers usually work with groups of bits called bytes. A standard byte contains 8 bits.

The meanings of bits - Like decimal digits, binary digits indicate some quantity, such as the distance along one axis from the origin of a coordinate system. The decimal number 4 may represent a geographic location four meters away from the origin along the Y axis. Likewise, the number 40 could represent a location forty meters away from the origin. With only nine digits, you can construct larger numbers like 40 by assigning a certain weight to each digit. In this example, the digit “4” in “40” is weighed ten-times more than the digit “0”. So, 40 actually means (4 * 10) + (0 * 1). In another example 3,862 can be expressed as (3 * 1000) + (8 * 100) + (6 * 10)+ (2 * 1).

Binary numbers work in exactly the same way. The only difference is that each digit represents a successively higher power of two, rather than a higher power of ten, because the binary number system only has two digits instead of the ten available in the decimal system.

For example, the number 1101 can be expressed as (1 * 8) + (1 * 4) + (0 * 2) + (1 * 1) for a total of 13, in decimal notation.

Another convenient way to think about binary digits is that they express the presence or absence of a value. Continuing the 1101 example, you could say “yes, there is an eight; yes, there is a four; no, there is not a two; and yes, there is a one”. Computers are well-suited to processing these types of presence/absence indicators because the transistors etched into their CPUs may exist in two states: allowing electricity to flow through, or preventing electricity from flowing through. Correlating the presence or absence of an electrical current to the presence or absence of values represented by binary digits allows engineers and programmers to build sophisticated systems based on a simple concept.


Bits and geodatabase coordinates

Geodatabase stores coordinate values using a signed, positive, 32-bit integer data type. One of the 32 bits is used as a sign bit, indicating positive or negative, leaving 31 data bits for storing coordinate information. If all of these 31 bits are set to 0, the resulting decimal number is 0.
This is the smallest coordinate value geodatabase can store internally. If all of the bits are set to 1, the resulting decimal number is 2,147,483,647. This is the largest coordinate value geodatabase can store internally.

These two extremes define the fixed, finite size of the geodatabase spatial domain. The data types used to store and process coordinate values are necessarily hard-coded into the software and cannot be altered. Note, however, that these values are unit-less.


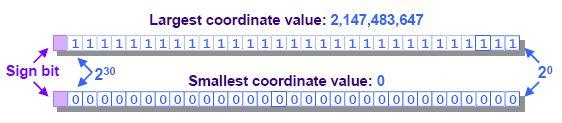
On a feature-class by feature-class basis you can set the 2,147,483,647 integer storage units to represent meters, miles, light-years, or any other unit of linear measurement by choosing the appropriate precision value. This gives you flexibility to stretch those roughly two-billion units over any sized geographic area.

So... now you can understand the secret of storing X/Y or Latitude/Longitude coordinates in GIS. This has been used for many years... and now its capabilities are not only limited to file storage but also enterprise storage like Oracle, SQL Server, DB2 etc.

Wednesday, October 19, 2005

Geodatabase... GIS Database... Part 1

Coordinates (X/Y or Latitude/Longitude) in geodatabase consists of at a minimum an X and Y pair, sometimes Z and M. Each of these values x,y,z and m is represented in the internal geodatabase storage as 32 –bit integers. This Integer is not a MSAccess or Oracle datatype... this is a C/C++ Data Type which is 32 bit in size. The order in which these coordinates are stored is also known as BINARY STREAM: x1/y1, x2/y2, …. x/y. This BINARY STREAM is something like a bit array or enumerations (if you are familiar with programming).

These coordinates or sets of it... creates POINTS, LINES and POLYGON features in GIS.

OK so far?? I think better I explain from high-level then into juicy details... lets start my explanation from simple to complicated. Some of the explanation below are from ESRI documentation... some my own research.

A. Float Point storage in Geodatabase


Geodatabase (personal or ArcSDE) stores geometry coordinates as Integer data type (32 bit) streams internally in a SHAPE field (personal) or POINTS field (ArcSDE).


Basically, you can scale floating-point values to a larger integer value in order to preserve information stored in digits to the right of the decimal point. In a simple example, the number 3.6 could be stored as the integer value 36 with no loss of information. By multiplying each floating-point number by 10 before converting it to an integer, you can preserve one decimal digit. To convert back to floating-point, the 36 value would be divided by 10, resulting in the number 3.6.

The precision you choose when creating a new feature class should reflect the quality of the source coordinate data. Higher-resolution data requires a higher precision value to preserve all of the known information recorded in the floating-point coordinate values.

Not all digits in a floating-point number represent actual data, though. A data capture device, such as a scanner, may be able to resolve coordinate locations within one foot when reading a 1:20,000 scale map. But on the scanned paper map, the pen used to draw a line representing a river may cover 40 feet on the ground. As a result, the computer would end up storing 40 times more data than is necessary to represent the actual information contained in the map.

Be aware that it is impossible for the computer to determine the quality of your data for you. For example, you may purchase an economical global positioning system (GPS) at most sporting supply stores. You could read the display on your GPS receiver and determine that your office is located at –120.4832765 degrees longitude and +34.5912634 degrees latitude. But, those values may only be accurate to four decimal places, not the seven displayed on the receiver. You could create a feature class with a precision of only 10,000 and still preserve all of the true information collected by your GPS receiver.

Without input from you, the ArcGIS software or a client application will calculate the largest precision possible for a given dataset, approximately, in order to preserve the most information from the source floating point numbers. This will result in unnecessarily large storage requirements. Information regarding data quality should accompany any data source, either digitally or as supporting hard-copy documentation.

Monday, October 17, 2005

savage earth .... or divine grace??

40,000 pakistani quake victims http://news.bbc.co.uk/1/hi/world/south_asia/4344332.stm

1200 new orleans hurricane victims http://edition.cnn.com/SPECIALS/2005/katrina/

350 children and adults died at Beslan siege http://edition.cnn.com/2004/WORLD/europe/09/04/russia.school/

170,000 tsunami victims http://www.cnn.com/2004/WORLD/asiapcf/12/28/tsunami.deaths/index.html

For those watching Discovery Channel... last weekend I was glued to the 'Savage Earth' series... no human, however hard their hearts might be will not be moved by those chaotic scenes, desperation, tragedy, disaster, hunger, government lies... and extreme human suffering. These are really amazing times we live in... amazingly sad... there are just too many disasters all over the world... I bet its gonna touch everyone's life sooner or later. Thats you and me. I hope these are not signs of worse to come.

Why is this happening?? What is the solution?? Who do we blame?? We keep asking these questions... but somehow the answers are never straight. Its too vague. Everybody seems to hide something... nobody can be trusted. Something like this is beyond anyone's control... we cannot... we shouldn't. Politics and greed just makes it worse. Just imagine the trauma and grief these families and friends suffer. Many are suffering in silence every single minute. Losing everything you love and own is close to living in hell. Very close...

Hell: A situation or place of evil, misery, discord, or destruction: “War is hell” (William Tecumseh Sherman). Torment and anguish

What really touches me is the amount of children and innocent babies that become victims. They don't have the voice to speak... some barely can walk.. lost in agony... and we can clearly see the deep sadness in their tired eyes... waiting for hope.. love. All they can do is cry and wait. There are no more tears left... no more time to wait... So much pain till there is only silence. The eerie silence of... death.

May your souls rest in peace and God have mercy on us...

Tuesday, October 11, 2005

not again lah... aiyoh...

Where are the satellite images… aerial photos… extent of damage maps?? Pakistan and India are scrambling to find satellite images of the disaster area. 20,000 deaths is such a tragic blow to the land of beautiful and breathtaking mountainside. Nature when reveals her fury has no mercy or compassion… what’s damn tragic is many of the victims are children and babies.

Both governments are ill-prepared in analyzing the damage, executing emergency responses and also distributing aid to these people. Times like this we the GIS community or the United Nations should send mapping, imagery and GIS specialists to assist in proper planning, aid and recovery.


Its really sad to know that there is no automated warning system for this earthquake, infrastructure to withstand damage or enough health facilities to handle this huge disaster.
Instead of pointing fingers or blaming others… lets contribute at least something to these people.

If you meet a Pakistani or Kashmiri or the Red Cross… be generous. Lets also pray for them.

Check out more here:
http://tsunami.geo.ed.ac.uk/local-bin/quakes/mapscript/show_map.pl

Saturday, October 08, 2005

can you find ur way home??


Many early explorers use geomatics to map their journey … on sea or land. Explorers usually are equipped with the knowledge of mapping and geomatics… they bring along mappers and navigators... altering maps as they discover. Christopher Columbus (1451-1506) unknowingly… discovered Americas. Sir Francis Drake’s (1540-1596) first voyage around the world is truly an amazing feat... sparking the British dominance of the seas... and without his geomatics instruments there is no way to navigate lah. Bartolomeu Dias' (1450-1500) discovery of the Cape of Golden Hope and Vasco da Gama ‘s (1460-1524) voyage to India are fine examples of the geomatics marvel and changing the course of the world's history. Lets not forget the torturous journey Ferdinand Magellan's (1480–1521) took to discover new routes. Brave and brilliant men.


Today's examples are… modern nautical charts, world maps, cadastral (land parcel) surveying, geological surveying or contour mapping... there are so many others too… built environment kinda surveying like bridges, roads, buildings… cool huh. This is like a whole new ball game in getting accurate readings of where we are in this universe. Sadly…sometimes the more accurate these drawings become… it actually turns into skillful drafting work… the artistic touch is lost when it becomes too technical.

Ask yourselves again… How do you navigate in the seas… no point of reference?? How did they sail at night?? How did they map out all those shipping routes… avoiding obstacles as they go?? Those were exciting and dangerous times… adventurous and also… full of mystery. Geomatics has come a long… long way… but for me … the fundamental principle of discovery, adventure and art is always there in mapping … whether 200 years ago or today.


With computers... GIS is changing all this today. A new era of mapping and discovery.

Friday, October 07, 2005

roam if you want to, roam around the world...

Hey.. reminds me of a B-52s classic... yes its a classic now... getting old... hahahahaa

roam if you want to
roam around the world
roam if you want to
without anything but the love we feel

fly the great big sky see the great big sea
kick through continents bustin bounaries
take it hip to hip rock it through the wilderness
around the world the trip begins with a kiss


Oklah… so far I have blogged a bit about programming, software, map theories, GPS, GIS data, satellite images… hhmmmm… we really now cannot avoid mentioning methods of acquiring spatial or geographic data. Spatial data here actually means maps…. or in more technical terms.. Vector (XY or Lat/Long in Points, Lines or Polygons) or Raster (Imagery). This field of study is also called geomatics.

What is this Geomatics?? Its like …. methods, skill and steps to get or record spatial data… basically XY or Lat/Long coordinates lah. All the collected points must be geographically referenced… what this means is all these numbers must actually mean something on the earth’s surface.

Its actually a mixture of science and art… instruments and algorithms(formulaes) to obtain location information is a scientific field of study… the geographer or mapping cartographer is the true artist. Masters (sifuuuu) like Da Vinci also drew maps among others. Trust me… there are so many equipments and instruments to find anything on, above or under the earth’s surface…

Monday, October 03, 2005

satellite images... click & smile... you r on "candid camera"..

I would say the best way to view the earths surface these days... fast and efficiently... is by using digital maps and imagery views from satellites. Its super fast, affordable and extremely reliable.

Check this out:
http://www.digitalglobe.com/
http://www.spaceimaging.com/

Satellite imagery currently is becoming the de-facto guide to spatial analysis and location finding for many GIS applications. Gone are the days when you have to fly a plane and take aerial photos. The synergy between Remote Sensing and GIS too is becoming closer based on the various GIS user needs and applications.

2 of the most popular satellites that provide images are QUICKBIRD and IKONOS... anywhere... all over the world. They are currently the market leaders in satellite imagery with quick and accuracte images. The pricing is also very competitive and the data is always up to date. Place an order and you can get an image within 7 days. These satellites circle the globe in about 3 days. There are a few resellers in Malaysia that provide these services including MACRES (Malaysian Centre for Remote Sensing) who owns and runs a ground receiving station.

There are various customer requirements and that results in various range of image resolution and spectral options. Accuracy is determined by matching the actual ground location with the image pixels.


Robert HavellAmerican, 1793 - 1878
Carolina Pigeon or Turtle Dove, 1827
Hand-colored etching and aquatint on Whatman paper